Year-over-year comparison
Last updated November 11, 2026
SankeyArt can show how each node changed compared to another value, such as last year's. The change appears as a third line in the node's label, for example "12% Y/Y" or "-5% Y/Y".
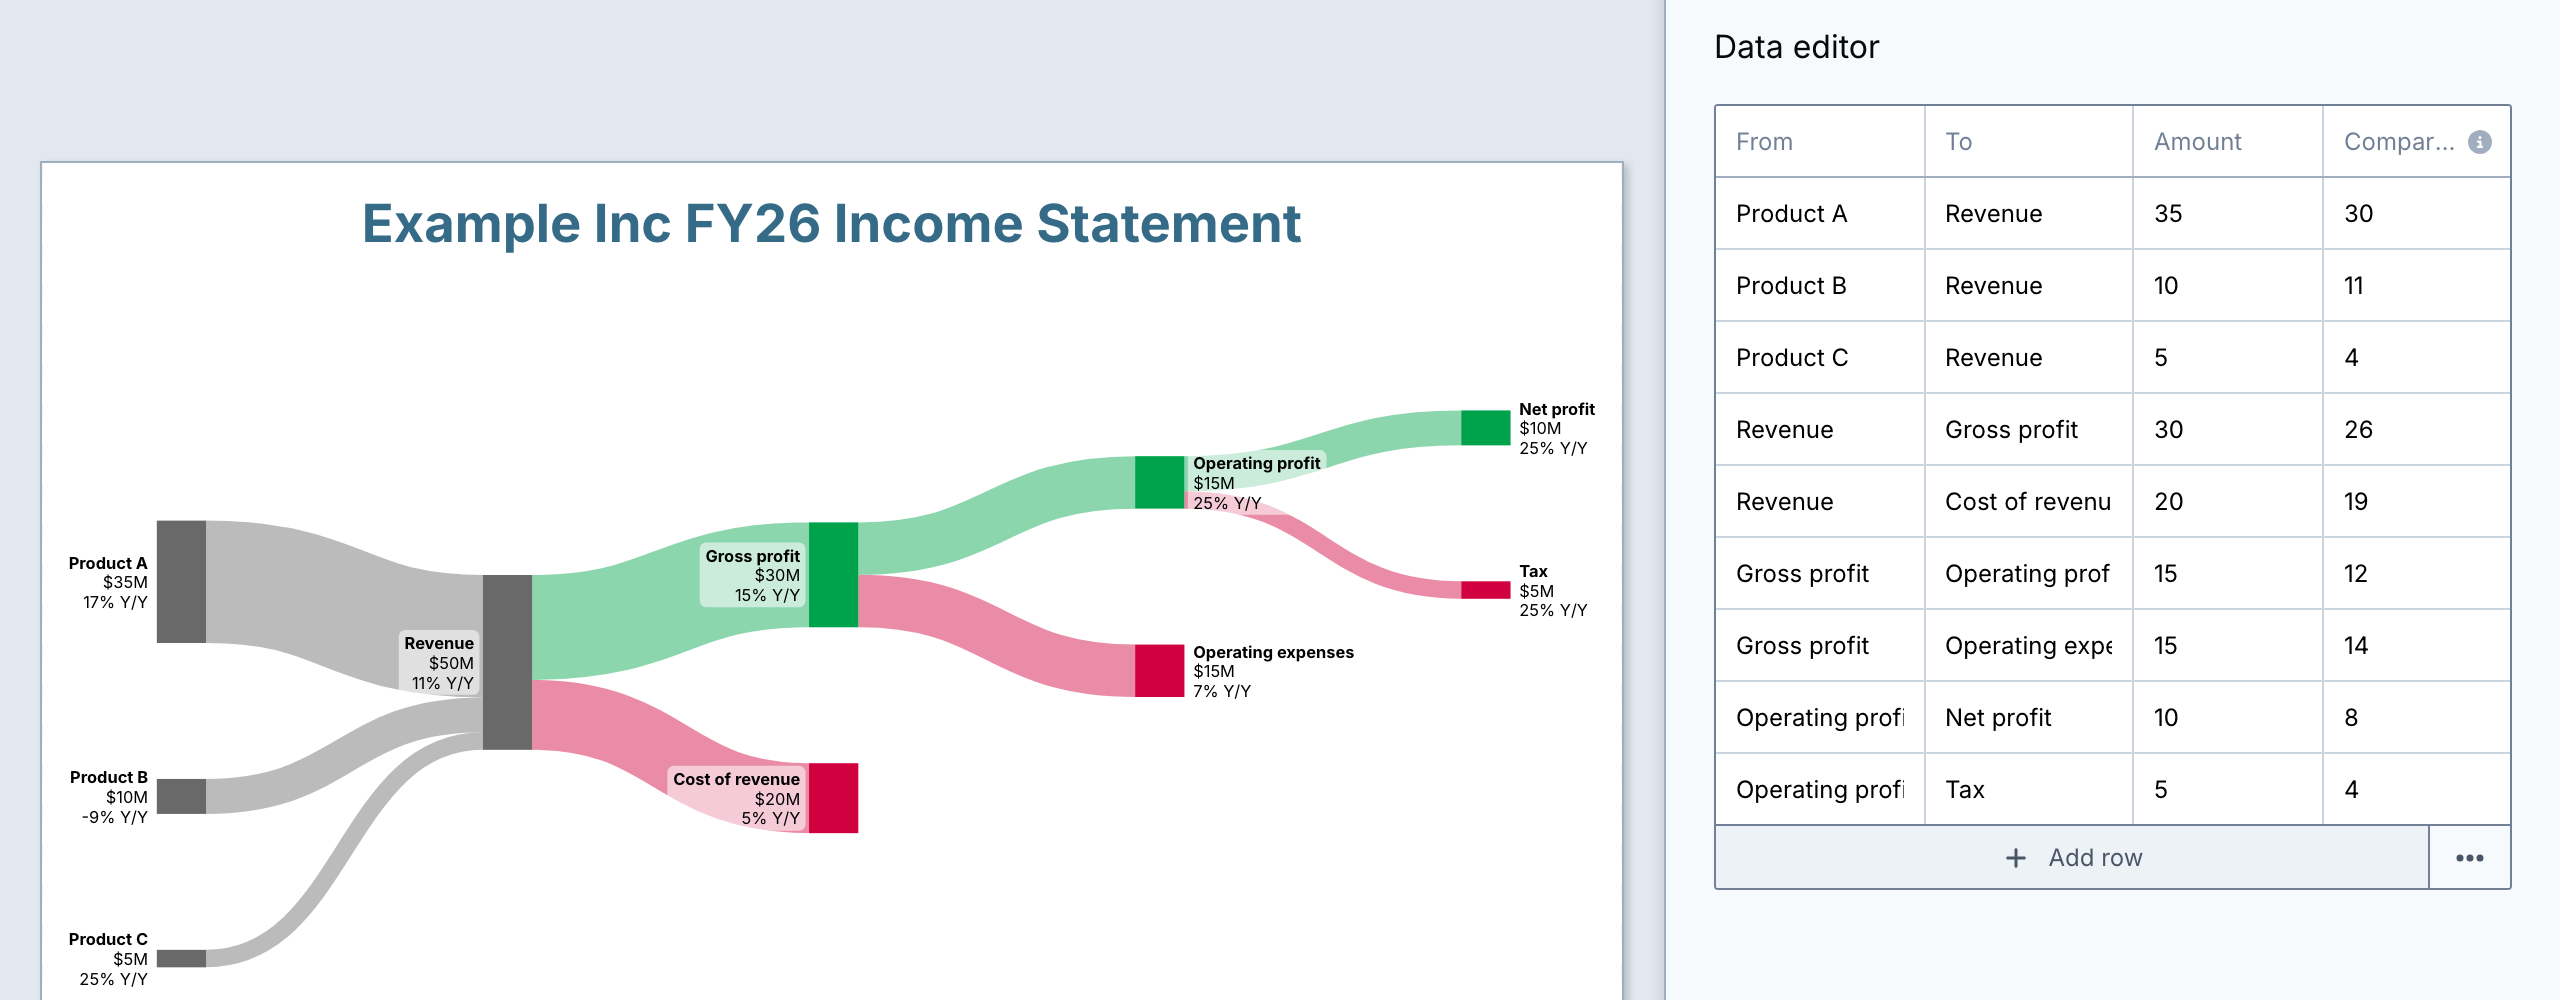
Enter the comparison values#
- In the Data editor, enter last year's value of each flow in the Comparison column.
- Open the View menu and make sure Show comparison line is selected. It needs Show diagram labels to be on.
SankeyArt compares each node's Amount with its Comparison value and shows the difference. You can also enter the comparison value of a flow by selecting the flow in the diagram.
The Comparison column works with any value you want to compare with, for example the previous quarter or the budget. Change the label's suffix to match.
Choose percentage or absolute change#
Open the Labels menu. In Comparison (3rd line):
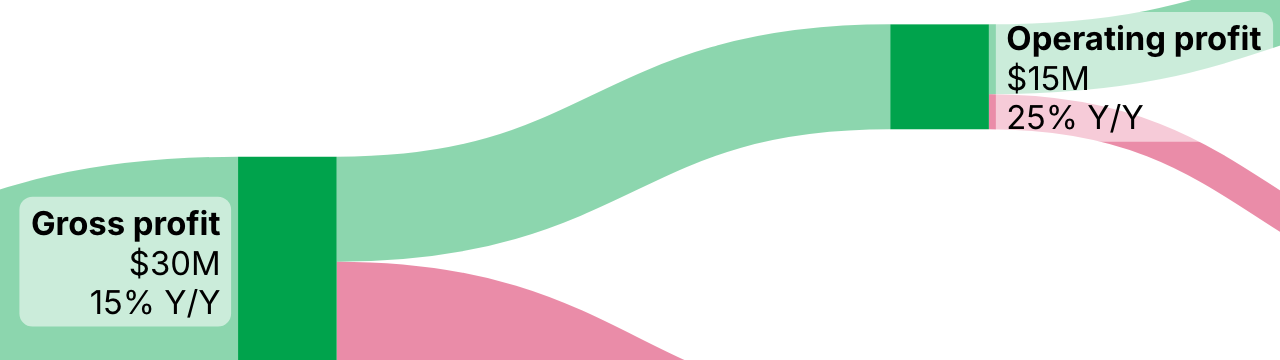
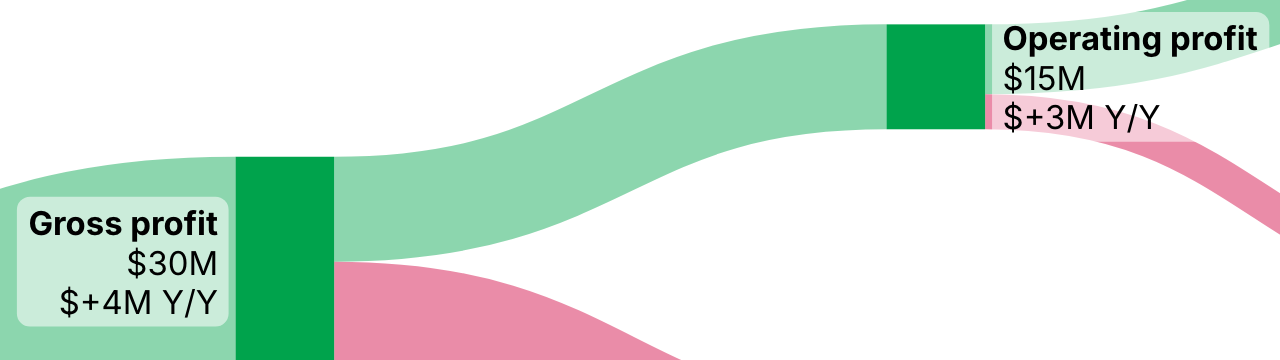
- Value: Percentage shows the relative change, rounded to a whole number. Absolute shows the difference, with a "+" for increases.
- Prefix and Suffix: text before and after the value, for example " Y/Y" as the suffix.
With Percentage, the third line shows the change in %:
With Absolute, it shows the difference. The comparison line has its own Prefix and Suffix, here "$" and "M Y/Y":
Absolute uses the Decimal places of the labels. See Labels and number formats.
To write the third line of a single node yourself, select the node and use 3rd line custom text.
When a node shows no comparison#
A node shows no comparison line when:
- one of its flows has no Comparison value, or
- its comparison value is 0 and the Value is Percentage, because a change from zero has no percentage.
Give every flow a Comparison value so that every node can show its change. Comparison values can be 0 but can't be negative.
Nodes whose flows don't add up#
SankeyArt adds up the flows into a node and the flows out of it. If the two totals differ, it uses the greater one. It does the same for the comparison values. The year-over-year change compares these two values.
Make sure each node receives all its flows in both years. Otherwise, the changes can't be calculated consistently.