Input data structure
Last updated November 11, 2026
A Sankey diagram is built from flows. This article explains how to enter them in the Data editor so that the diagram looks the way you expect.
One row per flow#
Each row describes one flow between two nodes:
| Column | What to enter |
|---|---|
| From | The node the flow starts at |
| To | The node the flow goes to |
| Amount | The value of the flow. It must be greater than 0. |
| Comparison | Optional. A value to compare with, such as last year's. It can't be negative. |
The diagram reads from left to right: every flow runs from its From node to its To node.
Nodes are created from the names#
You don't create nodes separately. Every name in From or To becomes a node, and the same name always means the same node. While you type, the editor suggests the names you already used.
To rename a node everywhere, select it in the diagram and change its Label.
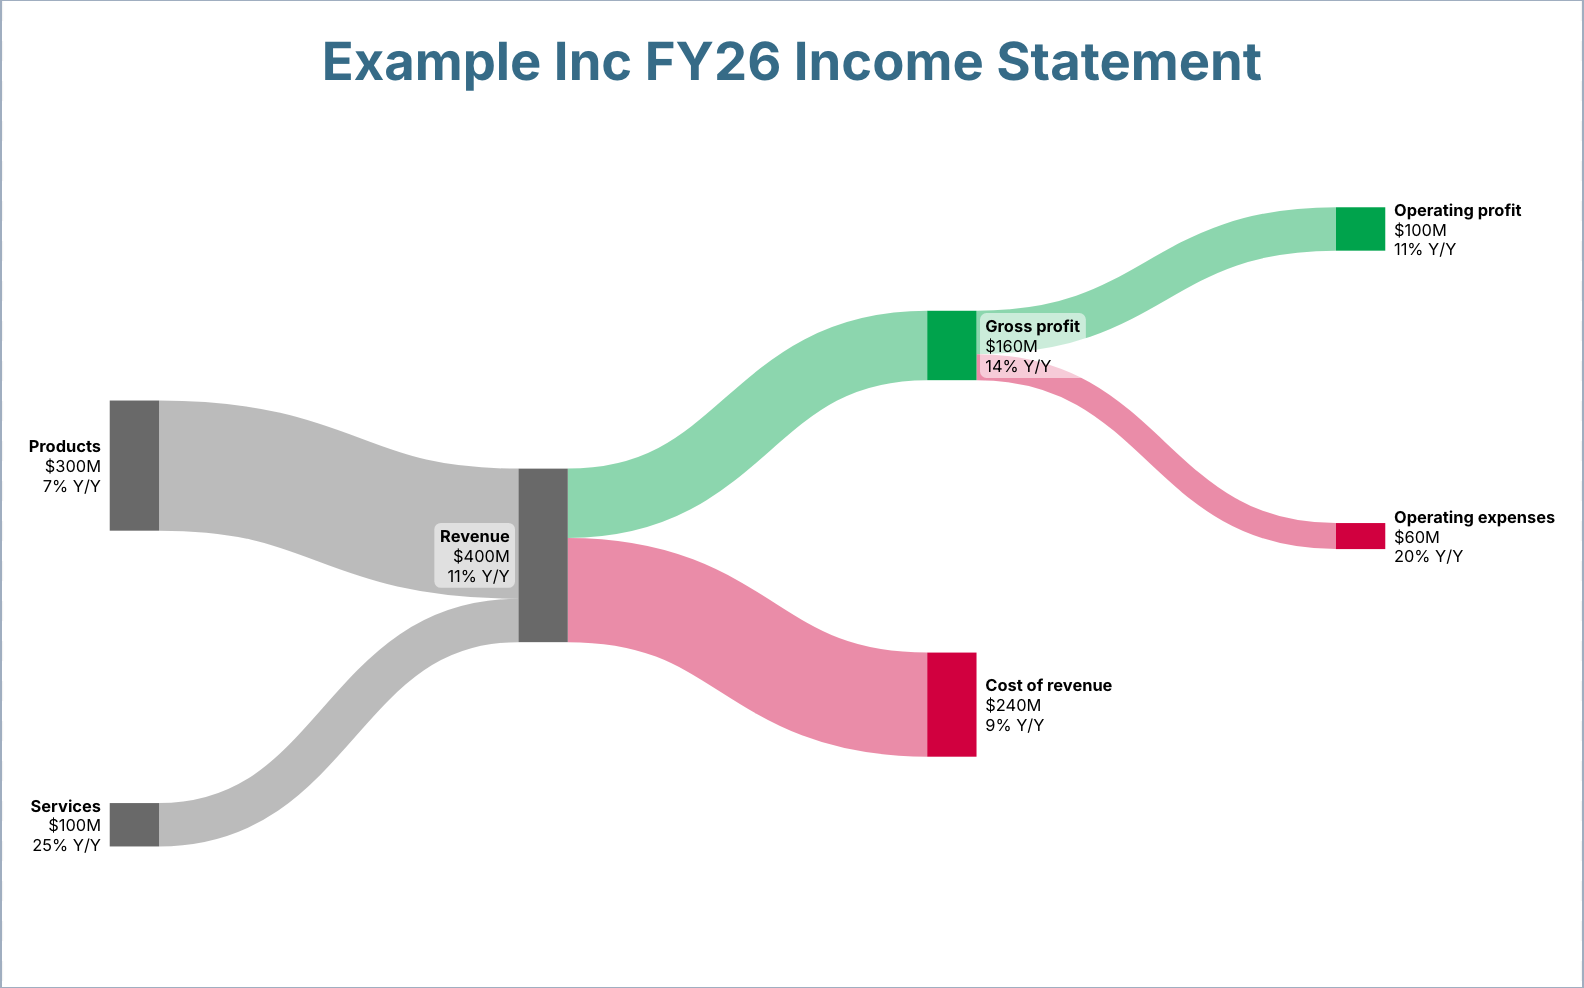
Example: an income statement#
| From | To | Amount | Comparison |
|---|---|---|---|
| Products | Revenue | 300 | 280 |
| Services | Revenue | 100 | 80 |
| Revenue | Gross profit | 160 | 140 |
| Revenue | Cost of revenue | 240 | 220 |
| Gross profit | Operating profit | 100 | 90 |
| Gross profit | Operating expenses | 60 | 50 |
These rows give this diagram, with "$" as the prefix and "M" as the suffix of the amounts:
A node's value#
A node's value is the sum of its flows. If the flows into a node and the flows out of it don't add up to the same total, SankeyArt uses the greater of the two.
When this happens, a yellow badge appears next to Data editor. Select it to see Some nodes are not balanced, with Total In, Total Out and the Difference for each node.
Order of the nodes#
Within a column, nodes are stacked in the order in which they first appear in the rows. List the rows from top to bottom: for example, profits before costs, as in the example above.
You can also drag a node in the diagram to move it.
Errors in the data#
A red badge next to Data editor shows how many issues need your attention. Select it to see them, and select Fix to go to the cell. For example:
- Amount must be greater than 0. Negative values aren't possible. To show a loss, see Losses and unprofitable companies.
- Comparison amount cannot be negative.
Work with rows#
- Add row adds an empty row at the end.
- Right-click a row to Insert row below, Duplicate row or Delete row.
- Select the ⋯ button next to Add row, then Clean up empty rows.
The Data editor holds up to 1,000 rows. The diagram shows the first 300.
Data from Excel#
You can paste cells from Excel or Google Sheets into the Data editor. A diagram created with the Excel add-in takes its data from the spreadsheet: change the cells there instead. See Create a diagram from Excel data.