Format labels in Power BI
Last updated November 11, 2026
Each node in the SankeyArt visual has a label with its name, its amount and, if you use Comparison, a comparison value. This article shows where to change how they look.
You find all settings in the Format pane of the visual.
Change the number format#
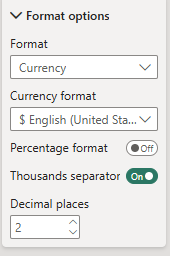
The number format isn't on the Visual tab. It's on the General tab:
- Select the visual and open the Format pane.
- Go to the General tab and open Data format.
- Set the format, for example Currency, and pick your currency format, e.g. $ English (United States).
- Turn the thousands separator on or off and set the number of decimal places.
To apply the settings to specific measures only, use Apply settings to.
Shorten large numbers#
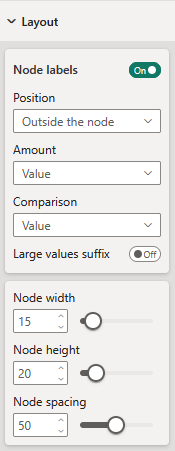
In Layout, turn on Large values suffix to shorten large numbers, for example 1.2M instead of 1,200,000. It's off by default, so the labels follow your measure's format.
Large values suffix overrides the decimal places from Data format. If your decimal places don't show up, turn it off.
Before version 1.4 of the visual, Large values suffix was on by default. Reports where nobody changed it now show full numbers instead of 1.2M. Turn it on to get the short numbers back.
Change the fonts#
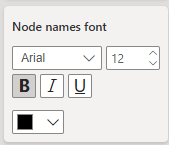
In Branding, you set the fonts for the three parts of the labels:
- Node names font: the names of the nodes
- Amounts font: the amounts
- Comparisons font: the comparison values, such as year-over-year changes
For each, you can set the font family, size, bold, italic, underline and color.
Show, hide or move the labels#
In Layout, use Node labels to turn the labels on or off. When they're on, choose where they go in Position: Before the node, After the node, Outside the node (the default) or Inside the node.
Change one node's label or color#
While you edit the report, hover over a node and click the pencil button above it. In the popup:
- Color: pick one of your brand colors, another color from the diagram, or any color.
- 2nd line custom text: replaces the amount. Turn on its checkbox and type the text, for example "-". Leave the text empty to hide the amount.
- 3rd line custom text: replaces the comparison value in the same way. It's there when you use Comparison.
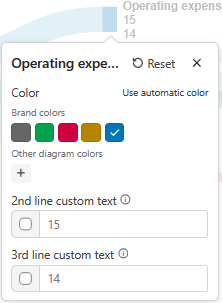
Custom texts are handy for a middle node like Gross profit, where the value is clear from the flows.
To undo a node's color, texts and position, select Reset in its popup. To undo them for all nodes, go to Nodes in the Format pane and turn on Reset all node customizations.
Changes you made to single nodes before version 1.4 of the visual, in the former Individual nodes section, are lost and have to be made again.
Choose what the comparison shows#
In Layout → Node labels → Comparison, choose what the third line of each label shows:
- Value: the comparison value itself, for example last year's amount. This is the default.
- Change in %: how much the amount changed, for example +15%.
- Change: the difference, for example +$40.
- Hidden: no comparison.
Show percentages#
Don't put a percentage measure in Amount or Comparison. The visual adds up values per node, so nodes in the middle get the wrong percentage. See Data structure in Power BI.
Keep Amount as the plain amount and choose what the labels show in Layout → Node labels → Amount:
- % of neighbor: the node's amount as a share of the node it flows into, or comes from, when there's just one. In a funnel, that's the conversion from the step before.
- % of highest: the node's amount as a share of the largest node. In an income statement that's revenue, so the labels show margins.
- Value (% of neighbor) and Value (% of highest): both, for example $181B (46%).
- Hidden: no amount.
When a percentage can't be calculated, for example for a node with several inflows and outflows, the label shows just the amount.