Data structure in Power BI
Last updated November 11, 2026
The SankeyArt visual for Power BI draws a diagram from one table with one row per flow. This article explains the fields and how to structure the table.
Fields#
The visual needs three fields:
| Field | What goes in it | Example |
|---|---|---|
| Source | The node a flow starts from | Revenue |
| Target | The node a flow goes to | Cost of revenue |
| Amount | The size of the flow | 210.4 |
And has two optional ones:
| Field | What goes in it |
|---|---|
| Comparison | The same amount for another period, e.g. last year or the budget, to show changes |
| Sorting | A whole number (1, 2, 3, …) for the order in which flows are stacked |
Amount must be a number column. In Power BI, numeric columns have a Σ sign next to them.
One row per flow#
All flows go in the same table, whichever level of the diagram they belong to. A node is just a name: when the same name appears in several rows, those rows meet at that node.
- Branches: repeat a Source. Revenue → Cost of revenue and Revenue → Gross profit split Revenue into two flows.
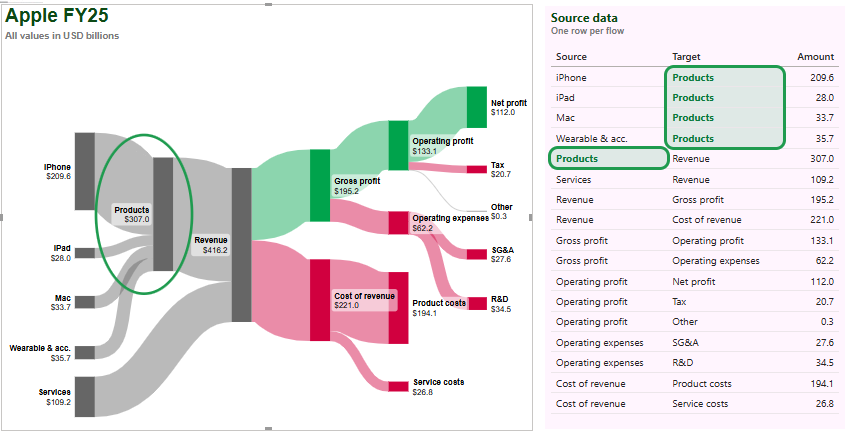
- Joins: repeat a Target. iPhone → Products, Mac → Products and iPad → Products merge into Products.
- Levels: use a Target as the Source of another row. iPhone → Products and Products → Revenue put Products in the middle, which adds a column to the diagram.
Here are the first rows of Apple's FY24 income statement, in billions of dollars:
| Source | Target | Amount |
|---|---|---|
| iPhone | Products | 201.2 |
| Mac | Products | 30.0 |
| iPad | Products | 26.7 |
| Wearables & accessories | Products | 37.0 |
| Products | Revenue | 294.9 |
| Services | Revenue | 96.2 |
| Revenue | Cost of revenue | 210.4 |
| Revenue | Gross profit | 180.7 |
| Gross profit | Operating expenses | 57.5 |
| Gross profit | Operating profit | 123.2 |
In a Power BI report, Apple's FY25 income statement looks like this, with its source data next to the diagram. The rows that have Products as their Target meet at the Products node:
Order of flows#
The nodes of each column are stacked from top to bottom in the order in which they first appear in your rows. To set that order yourself, add a column with whole numbers (1, 2, 3, …) and drag it into Sorting. The rows are then read in that order, wherever they are in your table.
For example, in this table sorted by name, the Sorting column puts the products by size:
| Source | Target | Amount | Sorting |
|---|---|---|---|
| iPad | Products | 26.7 | 4 |
| iPhone | Products | 201.2 | 1 |
| Mac | Products | 30.0 | 3 |
| Products | Revenue | 294.9 | 5 |
| Services | Revenue | 96.2 | 6 |
| Wearables & accessories | Products | 37.0 | 2 |
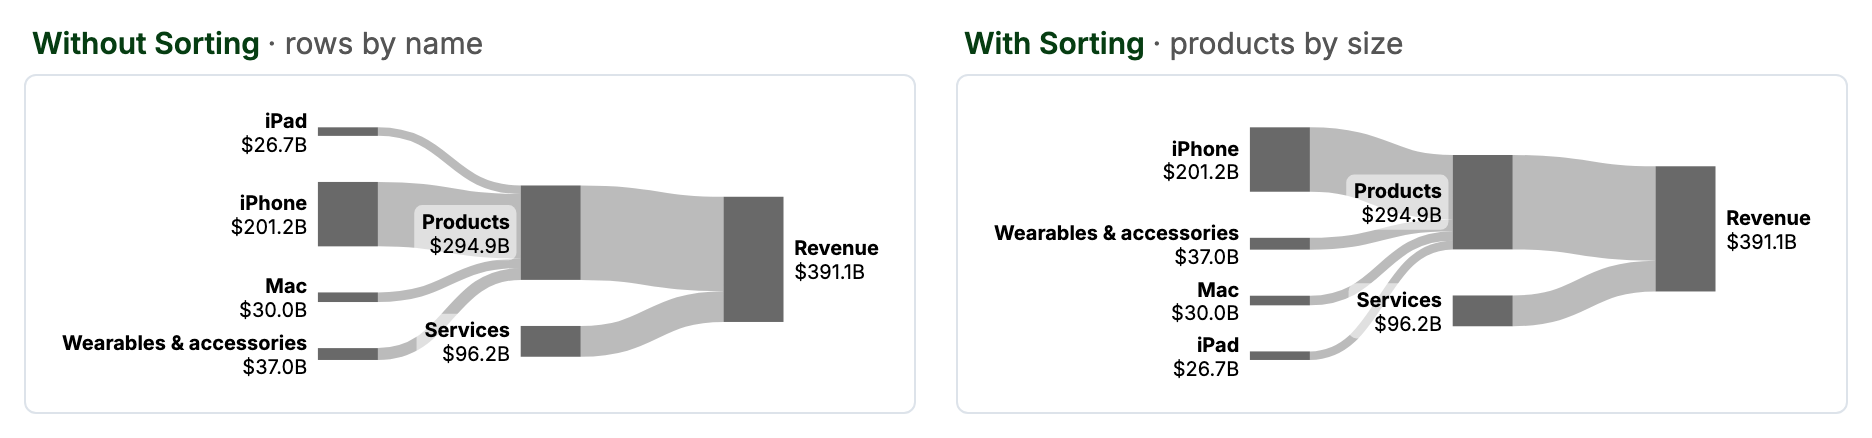
You can also drag any node on the canvas to move it. The flows follow the node.
Show changes with Comparison#
Put the amount for another period, usually last year, in Comparison. If your table has a column per year, that's last year's column. If you have a date table, it's a measure like Amount PY = CALCULATE(SUM(Flows[Amount]), SAMEPERIODLASTYEAR('Date'[Date])).
Comparison values are added up per node the same way as amounts. The label can show the comparison value, the change in % or the change, see Format labels in Power BI.
Use amounts, not percentages#
Don't put a percentage measure, such as "% of source", in Amount or Comparison. The visual adds up values per node, so nodes in the middle end up with the wrong percentage. Keep Amount as the plain amount, and let the labels show percentages instead, see Show percentages.
If the diagram looks wrong#
- Names must match exactly. "Gross Profit" and "Gross profit" are two different nodes.
- Amount must be a number column, not text.
- Middle nodes show the larger side. A node with flows in and out shows the larger of its summed inflows and summed outflows. Ideally the two are equal.
- No loops. A flow back to a node on its left is drawn faintly. If the same step appears at two stages, give it two names, e.g. "Q1: Pending" and "Q2: Pending".
- Up to 100 flows. The visual shows up to 100 Source → Target pairs.
Data with stages as columns#
If your data has one row per customer and one column per stage (Stage 1, Stage 2, Stage 3, …), reshape it into Source and Target rows first, for example in Power Query:
- For each pair of neighboring stages, take the earlier stage as Source and the later one as Target.
- Drop the rows where Source or Target is empty.
- If the same value can show up at different stages, add the stage to it, e.g. "Stage 2: Drug A". Otherwise the flows loop back to earlier nodes.
- Append the pairs into one table, then group it by Source and Target and count the rows as the Amount. To show a value such as revenue instead, sum it.
Then drag Source, Target and Amount from the combined table into the visual.