Sankey diagrams
for Power BI
Build finance dashboards that everyone understands — P&Ls, cash flows, and cost breakdowns.
✓ Microsoft-certified Power BI visual
✓ Purpose-built for enterprise financial reporting
✓ Your data never leaves Power BI






Sankey diagrams are perfect for visualizing P&Ls and cash flows
Money flows through your business — and Sankey diagrams show exactly how.
Sankey charts make complex numbers easy to follow and hard to misinterpret.

The whole P&L in one chart
Intuitive yet information rich: A single Sankey diagram replaces multiple charts to visualize your profit & loss statement.
See at a glance:- Revenue categories
- Cost breakdown
- Year-over-year comparison
Interactive and explorable
-
Filter across reporting periods
(months, quarters, years) - Click Sankey branches to drill into details
Full control, yet simple to use
- Drag nodes to perfect your layout
- Show year-over-year comparison values
What customers say about our Sankey diagram web editor:
As CFO I look for ways to showcase data, and we wanted to use Sankey graphics for our financials. There were a number of companies and software providers offering 'easy' solutions.
We explored many of them, and found SankeyArt to have a very clean and user-friendly interface, quick and extremely cost effective.

Security and certification
Our Power BI visual is Microsoft-certified, ensuring security and compliance.
Diagram data is processed entirely within Power BI and is not transmitted to SankeyArt servers or
Microsoft-certified visual
Certified by Microsoft for security, performance, and compliance with Power BI standards. Learn about certification
Data privacy
All diagram data is processed within your Power BI environment. No data is sent to external servers.
Enterprise compliance
Meets Power BI's security requirements for enterprise deployments and governance.
Secure payments
Subscriptions are processed through Microsoft's secure payment infrastructure.
Simple, transparent pricing
Volume discounts • First month free • Additional 2 months free with annual billing
Self-serve
Through Microsoft AppSource
Per user, billed by Microsoft| Users | Per user/year | Monthly |
|---|---|---|
| 1–200 | $10.00 | $1.00 |
| 201–1,000 | $7.50 | $0.75 |
| 1,001+ | $5.00 | $0.50 |
Licenses are assigned by your admin through Microsoft, the same way as Office licenses.
Direct purchase
Organization License
Up to 250 users, 1 year- Pay by card or bank transfer
- Purchase orders accepted
- One fixed annual price, not per-user billing
Both paths include the same product and the same features.
Licenses apply to both report creators and viewers.
Frequently asked questions
Everything you need to know about SankeyArt for Power BI
#
#
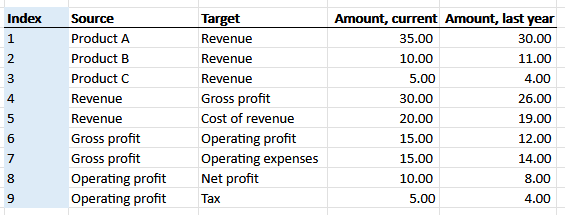
Add an integer column to your dataset (1, 2, 3, …) and drag it into the Sorting field. Flows will stack top to bottom in that sequence. This is useful for keeping Revenue at the top and Net Income at the bottom, just like you'd read an income statement.

Additionally, you can always click and drag any node on the canvas to reposition it. The flows redraw automatically to follow the node's new position.
#
#
#
- Embedded: Publish to Web and PaaS embed are not supported
- Commercial OEM: Using visuals in apps or solutions that are resold are not supported
- National/Regional clouds: Support depends on regional availability
- Export via REST API: PDF/PPT export are not supported
- Power BI Report Server (RS): On-Premises is not supported
#
#
Transform your financial data into clear insights
Use visual clarity to drive alignment and informed decision-making in your organization.
Add our enterprise-grade Sankey diagrams to your Power BI dashboards and reports.