Example quadrant chart positioning products by market growth and competitive strength, created with SankeyArt

Quadrant charts that deliver a verdict

Position products, projects, or competitors on a 2x2 matrix with labeled quadrants - the classic strategy chart, made easy.


When to use a quadrant chart

A quadrant chart is the right choice for

Positioning named items on two dimensions

Delivering a verdict: leaders, priorities, risks

Roughly five to fifteen labeled points

Quadrant chart examples

Four ways finance teams use quadrant charts, all built in the same editor.
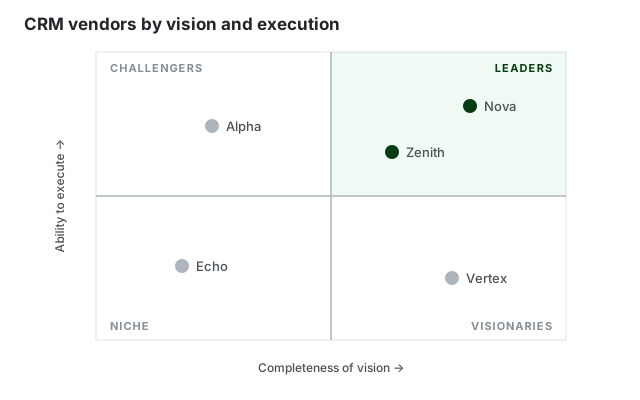
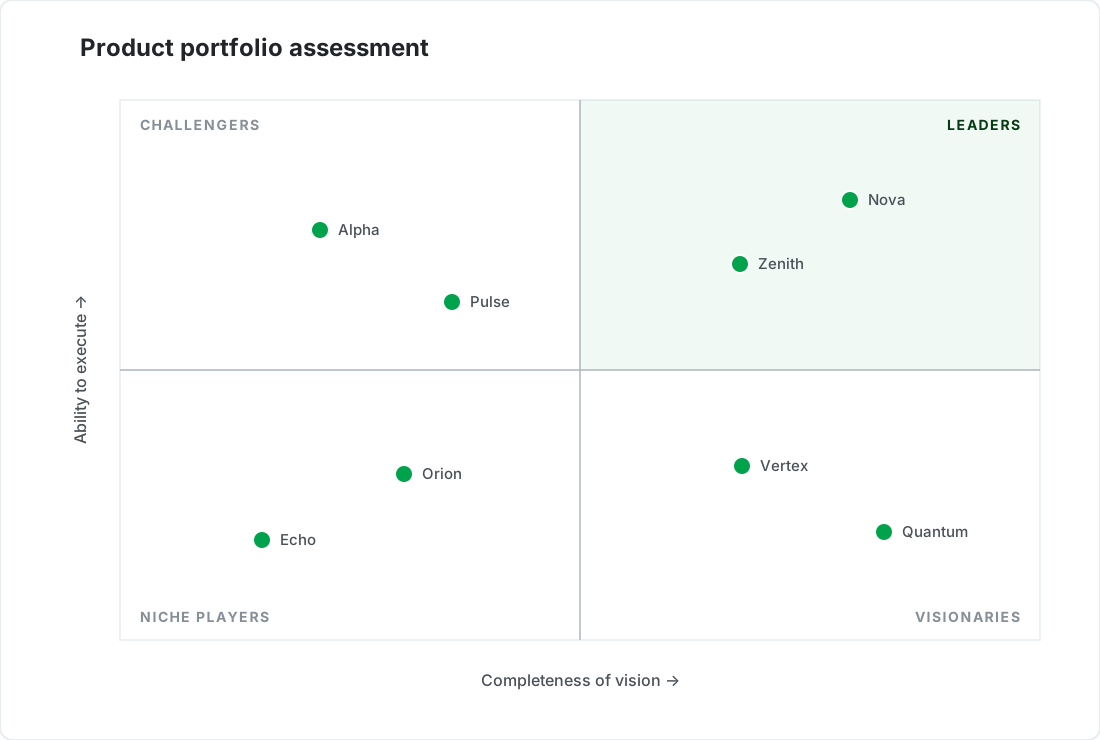
Quadrant chart example positioning vendors by vision and execution
Vendor landscape Who leads the market
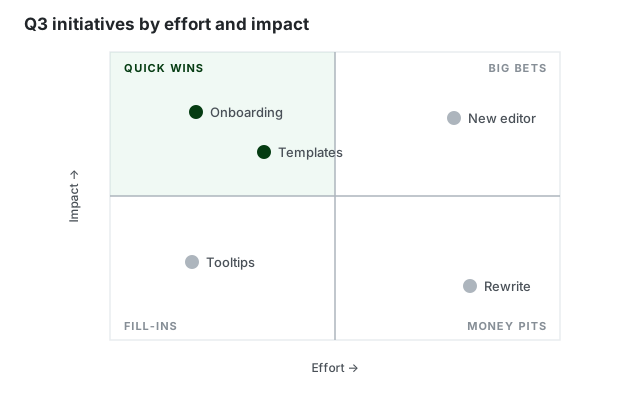
Quadrant chart example plotting initiatives by effort and impact
Effort vs. impact Decide what to build first
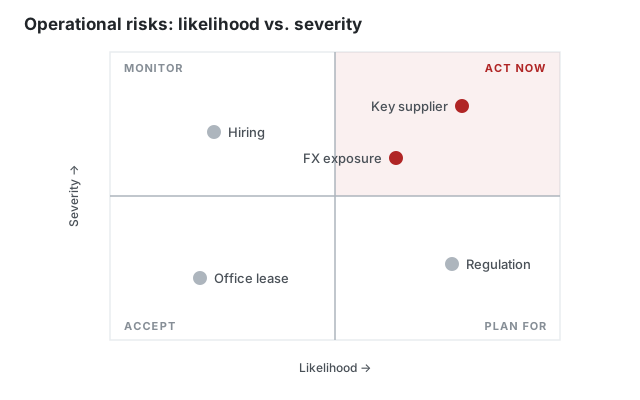
Quadrant chart example mapping business risks by likelihood and impact
Risk map Likelihood against severity
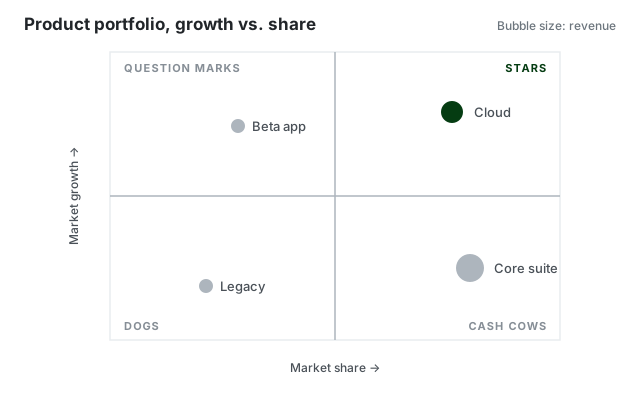
Quadrant chart example reviewing products by growth and market share
Portfolio review Growth against market share

Built for professional presentations

On-brand by default

Set your corporate colors and fonts once. Every quadrant chart you create follows your corporate design automatically - no manual restyling.

From data to diagram in seconds

Paste your numbers or type them in directly - no sign-in hoops and no clunky menus, just a beautiful chart.

Export anywhere

Download as high-resolution PNG or SVG and drop your chart into PowerPoint, Google Slides, reports, or web pages.

Frequently asked questions

Everything you need to know about creating quadrant charts with SankeyArt

Quadrant charts position items on two dimensions split into four labeled regions. Common uses are competitor and vendor comparisons, effort-versus-impact prioritization, and risk assessments.

Yes. You can name each quadrant (for example Leaders, Challengers, Niche, Visionaries) and label every point, with the axes centered vertically and horizontally.

Yes. Like our Sankey diagram editor, the new chart editors are built for on-brand output: you set your corporate colors and fonts once and every diagram you create uses them automatically.

Yes. You can download your chart as a high-resolution PNG or SVG and drop it straight into PowerPoint, Google Slides, reports, or web pages.

The editor is under active development. Click "Create diagram" and join the waitlist with your email address - we notify you the moment you can create your first diagram. Waitlist members get access before the public launch.

Create beautiful diagrams the easy way

Don't waste your time with complex software.