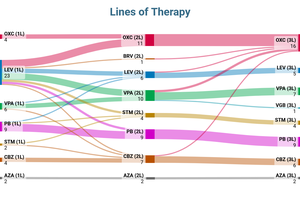
How to visualize lines of therapy charts
Filip Barl | June 17, 2026Learn how to create and customize lines of therapy charts with Sankey diagrams. A practical way to visualize treatment pathways, therapy switches and healthcare flows.
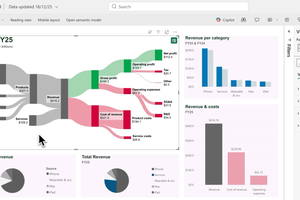
How to create and customize Sankey diagrams in Power BI
Filip Barl | Feb. 18, 2026Struggling to visualize flows in Power BI? Sankey diagrams make complex relationships intuitive.
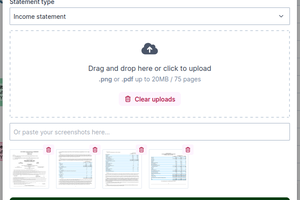
Introducing PDF smart imports ✨
Filip Barl | March 28, 2025We’re thrilled to announce the launch of Smart import, a powerful new feature that allows you to upload PDFs or images of your financial data and generate a Sankey diagram from it effortlessly!