How to create and customize Sankey diagrams in Power BI
Filip Barl
| Feb. 18, 2026
Feb. 18, 2026
Power BI is excellent at aggregating numbers, but visualizing flows between categories is where many reports fall short.
If you need to show how revenue moves through product lines, how customers transition between segments, or how costs break down across departments, a standard bar or column chart won't tell the full story.
That’s where Sankey diagrams shine. They make complex relationships immediately intuitive by showing both structure and magnitude in a single visual.
We are excited to share a deep dive into our Sankey Diagram for Power BI, a Microsoft-certified custom visual that brings beautiful, interactive Sankey diagrams right into your Power BI dashboards and reports.
What you'll learn
- How to add the SankeyArt visual to your Power BI report
- Which fields you need to build a Sankey diagram
- How to adjust key settings in the Format pane (Branding, Layout, Individual nodes)
- A few practical tips to improve readability and fine-tune your diagram

Installation
Getting started takes less than a minute - simply visit the Microsoft Marketplace from your Power BI app, search for "SankeyArt" and add the "Sankey Diagram for Power BI" visual. The visual will be automatically added to your Power BI environment and available in the visualizations pane. Or you can just grab it directly from the Microsoft Marketplace listing.
The free version works right away with a watermark, no credit card, no sign-up. When you're ready to remove it, you can activate a 30-day free trial. Licenses are managed through Microsoft's payment system, so your IT admin can assign them just like Office licenses.
Getting started
To create your first Sankey diagram in Power BI, add the visual to your canvas and connect your data. The visual needs three fields:
- Source: the starting node of each flow (e.g. "Revenue")
- Target: the ending node (e.g. "Cost of Goods Sold")
- Value: the numeric size of the flow
So your data should look something like a table with one row per flow. For example, a simple income statement might have "Total Revenue" → "Gross Profit" as one row, "Total Revenue" → "Cost of Revenue" as another, and so on.
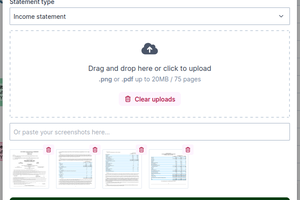
If you want to see a working example right away, you can download our sample .pbix file from the Marketplace listing. Just click "Download sample" and open it in Power BI Desktop. It comes with sample data already connected, so you can explore the visual and its settings without having to set anything up yourself.
Once you have a visual on the canvas with data connected, you're ready to start customizing.

Order of flows
This one's not immediately obvious, but it's important: you can control the vertical order in which flows are stacked. Just add an integer column to your dataset (1, 2, 3, …) and drag it into the Sorting field. The diagram will stack flows from top to bottom in that sequence.
This is especially useful for P&L Sankeys where you might want profit flows to show up at the top.
Settings overview
The Format pane has three main sections: Branding, Layout and Individual nodes. Let's go through each of them.
Branding
This is where you control colors and fonts across the whole diagram.
- Default color: Sets the baseline color for all nodes. Any node that doesn't have a specific color assigned will use this.
- Auto colors 🌟: This is one of our favorite features. You can define up to four auto color rules, each with a color and a list of match keywords. When a node's name contains one of the keywords, it automatically gets that color. For example, you could set up:
- Auto color #1 (green, ON): match keywords "profit, income, earning"
- Auto color #2 (red, ON): match keywords "expense, cost, loss"
- This way, all your profit-related nodes automatically show up in green and all cost-related nodes in red, without you having to color each one individually. You get four auto color slots, each with its own toggle so you can easily turn them on and off.
- Node names font: Set the font family, size, bold/italic/underline, and color for node labels. This is where you'd apply your corporate typeface.
- Amounts font: Same controls for the numeric values displayed on nodes.
- Comparisons font: Controls the font for comparison values (like year-over-year changes).


Layout
This section controls the spatial arrangement of the diagram.
- Node labels: Toggle labels on or off entirely. When on, you can choose the label position from a dropdown.
- Large values suffix: When turned on, large numbers get shortened with a suffix (like "1.2M" instead of "1,200,000"). Useful for keeping the diagram clean when you're dealing with big numbers.
- Node width: Controls how wide each node bar is. Wider nodes make the diagram feel more substantial, narrower ones leave more room for flows.
- Node height: Sets the minimum height of each node. Increase this if smaller nodes are getting too thin to read comfortably.
- Node spacing: The vertical gap between nodes in the same column. Decrease it to pack nodes more tightly, increase it to give the diagram more breathing room.

Individual nodes
This is where you can override settings on a per-node basis. Each node in your diagram gets its own expandable section with four toggles:
- Custom color: Override the default/auto color for this specific node. When you turn this on, a color picker appears. This takes priority over auto color rules.
- Custom amount: Override the displayed value for a node. For example, you could set a node's displayed amount to "-" if you want to hide the number, or show a custom label instead.
- Custom comparison: Override the comparison value shown for this node.
This section is especially handy for fine-tuning. Maybe auto colors handle 90% of your nodes correctly, but you need a specific node to stand out differently. Or maybe you want to suppress the amount display on an intermediate node like "Gross Profit" where the value is implied by the flows.

Tips & tricks
Drag and drop nodes
You can click and drag any node on the canvas to reposition it. This is really useful for fine-tuning the layout after the automatic positioning does its thing. For example, if two nodes end up too close together or you want to emphasize a particular flow by moving its source node higher up, just drag it where you want it. The flows redraw automatically to follow the node's new position.
Changing the number format
This one trips people up because it's not in the Visual tab. To change how amounts are formatted, go to the General tab in the Format pane and open "Data format". There you can set the format to Currency, pick your currency format, e.g. $ English (United States), toggle the thousands separator, and set the number of decimal places. You can also apply these settings to specific measures using the "Apply settings to" dropdown.

Security
Our Power BI visual is Microsoft-certified, meaning it passed Microsoft's review for security, performance, and compliance. All data is processed entirely within Power BI. Nothing is sent to our servers or any third-party services. Your financial data stays where it belongs.

👉 Try it out
Install the free version from the Marketplace to get started, no credit card needed. When you're ready for the full experience, start a 30-day free trial to remove the watermark.
We'd love to hear how you're using it - reach out anytime at [email protected].

Filip Barl
Filip is a software engineer and the technical mind behind SankeyArt.
He’s passionate about building great software and tackling complex technical challenges. With a strong interest in design and UX, he strives to create seamless and intuitive experiences.
He holds a master's degree in theoretical mathematics.